


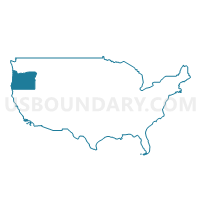
State Senate District 30, Oregon
About
Outline

Summary
| Unique Area Identifier | 201277 |
| Name | State Senate District 30 |
| State | Oregon |
| Area (square miles) | 35,913.24 |
| Land Area (square miles) | 35,706.77 |
| Water Area (square miles) | 206.47 |
| % of Land Area | 99.43 |
| % of Water Area | 0.57 |
| Latitude of the Internal Point | 43.87273110 |
| Longtitude of the Internal Point | -118.87809430 |
| Total Population | 115,913 |
| Total Housing Units | 54,920 |
| Total Households | 44,826 |
| Median Age | 42 |
Maps

Graphs
Select a template below for downloading or customizing gragh for State Senate District 30, Oregon


Neighbors
Neighoring State Legislative District Upper Chamber (by Name) Neighboring State Legislative District Upper Chamber on the Map
- Rural Nevada Senatorial District, NV
- State Senate District 11, ID
- State Senate District 15, WA
- State Senate District 23, ID
- State Senate District 26, OR
- State Senate District 27, OR
- State Senate District 28, OR
- State Senate District 29, OR
- State Senate District 9, OR
- State Senate District 9, ID
- Washoe County Senatorial District 2, NV
Top 10 Neighboring County (by Population) Neighboring County on the Map
- Washoe County, NV (421,407)
- Clackamas County, OR (375,992)
- Marion County, OR (315,335)
- Canyon County, ID (188,923)
- Deschutes County, OR (157,733)
- Linn County, OR (116,672)
- Umatilla County, OR (75,889)
- Malheur County, OR (31,313)
- Union County, OR (25,748)
- Wasco County, OR (25,213)
Top 10 Neighboring County Subdivision (by Population) Neighboring County Subdivision on the Map
- Redmond CCD, Deschutes County, OR (35,941)
- Sisters-Millican CCD, Deschutes County, OR (27,974)
- The Dalles CCD, Wasco County, OR (20,761)
- Estacada CCD, Clackamas County, OR (15,451)
- Prineville CCD, Crook County, OR (14,912)
- Ontario CCD, Malheur County, OR (14,095)
- Baker City CCD, Baker County, OR (10,893)
- Mount Hood CCD, Clackamas County, OR (10,600)
- Payette CCD, Payette County, ID (9,837)
- Madras CCD, Jefferson County, OR (9,776)
Top 10 Neighboring Place (by Population) Neighboring Place on the Map
- The Dalles city, OR (13,620)
- Ontario city, OR (11,366)
- Baker City city, OR (9,828)
- Madras city, OR (6,046)
- Nyssa city, OR (3,267)
- Warm Springs CDP, OR (2,945)
- Burns city, OR (2,806)
- Vale city, OR (1,874)
- Chenoweth CDP, OR (1,855)
- John Day city, OR (1,744)
Top 10 Neighboring Elementary School District (by Population) Neighboring Elementary School District on the Map
- Harney County School District 4, OR (803)
- South Harney School District 33, OR (165)
- Drewsey School District 13, OR (124)
- Juntura School District 12, OR (119)
- Diamond School District 7, OR (91)
- Suntex School District 10, OR (85)
- Frenchglen School District 16, OR (82)
- Pine Creek School District 5, OR (52)
- Double O School District 28, OR (27)
Top 10 Neighboring Secondary School District (by Population) Neighboring Secondary School District on the Map
Top 10 Neighboring Unified School District (by Population) Neighboring Unified School District on the Map
- Washoe County School District, NV (421,407)
- Redmond School District 2J, OR (45,507)
- Oregon Trail School District 46, OR (28,463)
- Hood River County School District 1, OR (22,346)
- Crook County School District, OR (21,037)
- North Wasco School District 21, OR (20,509)
- Ontario School District 8, OR (18,590)
- La Grande School District 1, OR (16,990)
- Humboldt County School District, NV (16,528)
- Jefferson County School District 509J, OR (16,028)
Top 10 Neighboring State Legislative District Lower Chamber (by Population) Neighboring State Legislative District Lower Chamber on the Map
- State House District 15, WA (132,788)
- Assembly District 32, NV (80,177)
- State House District 53, OR (73,781)
- State House District 55, OR (66,629)
- State House District 52, OR (63,241)
- State House District 18, OR (62,291)
- State House District 17, OR (61,383)
- State House District 59, OR (60,455)
- State House District 57, OR (57,718)
- State House District 60, OR (55,458)
Top 10 Neighboring 111th Congressional District (by Population) Neighboring 111th Congressional District on the Map
- Congressional District 1, ID (841,930)
- Congressional District 2, NV (836,562)
- Congressional District 4, WA (774,409)
- Congressional District 2, OR (769,987)
- Congressional District 3, OR (762,155)
- Congressional District 5, OR (757,128)
- Congressional District 4, OR (739,234)
Top 10 Neighboring Census Tract (by Population) Neighboring Census Tract on the Map
- Census Tract 9501, Klickitat County, WA (8,325)
- Census Tract 9701, Morrow County, OR (7,997)
- Census Tract 9603, Payette County, ID (7,970)
- Census Tract 9503, Klickitat County, WA (7,769)
- Census Tract 7, Deschutes County, OR (7,670)
- Census Tract 9501, Crook County, OR (7,267)
- Census Tract 6, Deschutes County, OR (6,537)
- Census Tract 9601, Payette County, ID (6,394)
- Census Tract 105, Humboldt County, NV (6,116)
- Census Tract 5, Deschutes County, OR (5,921)
Top 10 Neighboring 5-Digit ZIP Code Tabulation Area (by Population) Neighboring 5-Digit ZIP Code Tabulation Area on the Map
- 97058, OR (19,838)
- 97914, OR (19,205)
- 97754, OR (18,574)
- 97031, OR (18,375)
- 97814, OR (12,382)
- 97741, OR (11,912)
- 83661, ID (9,881)
- 83672, ID (8,583)
- 83619, ID (7,201)
- 98620, WA (7,123)
Data
Demographic, Population, Households, and Housing Units
** Data sources from census 2010 **
Show Data on Map
Download Full List as CSV
Download Quick Sheet as CSV
| Subject | This Area | Oregon | National |
|---|---|---|---|
| POPULATION | |||
| Total Population Map | 115,913 | 3,831,074 | 308,745,538 |
| POPULATION, HISPANIC OR LATINO ORIGIN | |||
| Not Hispanic or Latino Map | 96,792 | 3,381,012 | 258,267,944 |
| Hispanic or Latino Map | 19,121 | 450,062 | 50,477,594 |
| POPULATION, RACE | |||
| White alone Map | 96,420 | 3,204,614 | 223,553,265 |
| Black or African American alone Map | 716 | 69,206 | 38,929,319 |
| American Indian and Alaska Native alone Map | 5,721 | 53,203 | 2,932,248 |
| Asian alone Map | 972 | 141,263 | 14,674,252 |
| Native Hawaiian and Other Pacific Islander alone Map | 235 | 13,404 | 540,013 |
| Some Other Race alone Map | 8,585 | 204,625 | 19,107,368 |
| Two or More Races Map | 3,264 | 144,759 | 9,009,073 |
| POPULATION, SEX | |||
| Male Map | 59,675 | 1,896,002 | 151,781,326 |
| Female Map | 56,238 | 1,935,072 | 156,964,212 |
| POPULATION, AGE (18 YEARS) | |||
| 18 years and over Map | 88,984 | 2,964,621 | 234,564,071 |
| Under 18 years | 26,929 | 866,453 | 74,181,467 |
| POPULATION, AGE | |||
| Under 5 years | 7,377 | 237,556 | 20,201,362 |
| 5 to 9 years | 7,200 | 237,214 | 20,348,657 |
| 10 to 14 years | 7,502 | 242,553 | 20,677,194 |
| 15 to 17 years | 4,850 | 149,130 | 12,954,254 |
| 18 and 19 years | 2,917 | 105,730 | 9,086,089 |
| 20 years | 1,324 | 52,462 | 4,519,129 |
| 21 years | 1,182 | 50,575 | 4,354,294 |
| 22 to 24 years | 3,683 | 150,011 | 12,712,576 |
| 25 to 29 years | 6,506 | 265,033 | 21,101,849 |
| 30 to 34 years | 6,349 | 259,111 | 19,962,099 |
| 35 to 39 years | 6,351 | 251,163 | 20,179,642 |
| 40 to 44 years | 6,752 | 248,362 | 20,890,964 |
| 45 to 49 years | 7,826 | 262,879 | 22,708,591 |
| 50 to 54 years | 8,483 | 276,196 | 22,298,125 |
| 55 to 59 years | 8,663 | 273,423 | 19,664,805 |
| 60 and 61 years | 3,360 | 100,551 | 7,113,727 |
| 62 to 64 years | 4,695 | 135,592 | 9,704,197 |
| 65 and 66 years | 2,753 | 73,650 | 5,319,902 |
| 67 to 69 years | 3,859 | 96,197 | 7,115,361 |
| 70 to 74 years | 5,024 | 120,194 | 9,278,166 |
| 75 to 79 years | 3,722 | 91,601 | 7,317,795 |
| 80 to 84 years | 2,701 | 74,019 | 5,743,327 |
| 85 years and over | 2,834 | 77,872 | 5,493,433 |
| MEDIAN AGE BY SEX | |||
| Both sexes Map | 42.00 | 38.40 | 37.20 |
| Male Map | 40.80 | 37.30 | 35.80 |
| Female Map | 43.50 | 39.50 | 38.50 |
| HOUSEHOLDS | |||
| Total Households Map | 44,826 | 1,518,938 | 116,716,292 |
| HOUSEHOLDS, HOUSEHOLD TYPE | |||
| Family households: Map | 29,934 | 963,467 | 77,538,296 |
| Husband-wife family Map | 23,202 | 733,741 | 56,510,377 |
| Other family: Map | 6,732 | 229,726 | 21,027,919 |
| Male householder, no wife present Map | 2,137 | 70,921 | 5,777,570 |
| Female householder, no husband present Map | 4,595 | 158,805 | 15,250,349 |
| Nonfamily households: Map | 14,892 | 555,471 | 39,177,996 |
| Householder living alone Map | 12,407 | 416,747 | 31,204,909 |
| Householder not living alone Map | 2,485 | 138,724 | 7,973,087 |
| HOUSEHOLDS, HISPANIC OR LATINO ORIGIN OF HOUSEHOLDER | |||
| Not Hispanic or Latino householder: Map | 40,193 | 1,409,055 | 103,254,926 |
| Hispanic or Latino householder: Map | 4,633 | 109,883 | 13,461,366 |
| HOUSEHOLDS, RACE OF HOUSEHOLDER | |||
| Householder who is White alone | 39,601 | 1,339,740 | 89,754,352 |
| Householder who is Black or African American alone | 117 | 24,638 | 14,129,983 |
| Householder who is American Indian and Alaska Native alone | 1,564 | 17,811 | 939,707 |
| Householder who is Asian alone | 377 | 45,466 | 4,632,164 |
| Householder who is Native Hawaiian and Other Pacific Islander alone | 68 | 3,647 | 143,932 |
| Householder who is Some Other Race alone | 2,216 | 50,154 | 4,916,427 |
| Householder who is Two or More Races | 883 | 37,482 | 2,199,727 |
| HOUSEHOLDS, HOUSEHOLD TYPE BY HOUSEHOLD SIZE | |||
| Family households: Map | 29,934 | 963,467 | 77,538,296 |
| 2-person household Map | 15,027 | 438,909 | 31,882,616 |
| 3-person household Map | 5,679 | 211,114 | 17,765,829 |
| 4-person household Map | 4,581 | 175,719 | 15,214,075 |
| 5-person household Map | 2,619 | 81,168 | 7,411,997 |
| 6-person household Map | 1,156 | 33,409 | 3,026,278 |
| 7-or-more-person household Map | 872 | 23,148 | 2,237,501 |
| Nonfamily households: Map | 14,892 | 555,471 | 39,177,996 |
| 1-person household Map | 12,407 | 416,747 | 31,204,909 |
| 2-person household Map | 2,130 | 109,435 | 6,360,012 |
| 3-person household Map | 229 | 18,159 | 992,156 |
| 4-person household Map | 80 | 7,031 | 411,171 |
| 5-person household Map | 30 | 2,621 | 126,634 |
| 6-person household Map | 13 | 920 | 48,421 |
| 7-or-more-person household Map | 3 | 558 | 34,693 |
| HOUSING UNITS | |||
| Total Housing Units Map | 54,920 | 1,675,562 | 131,704,730 |
| HOUSING UNITS, OCCUPANCY STATUS | |||
| Occupied Map | 44,826 | 1,518,938 | 116,716,292 |
| Vacant Map | 10,094 | 156,624 | 14,988,438 |
| HOUSING UNITS, OCCUPIED, TENURE | |||
| Owned with a mortgage or a loan Map | 17,607 | 678,120 | 52,979,430 |
| Owned free and clear Map | 12,239 | 266,365 | 23,006,644 |
| Renter occupied Map | 14,980 | 574,453 | 40,730,218 |
| HOUSING UNITS, VACANT, VACANCY STATUS | |||
| For rent Map | 1,382 | 40,193 | 4,137,567 |
| Rented, not occupied Map | 121 | 2,608 | 206,825 |
| For sale only Map | 788 | 24,191 | 1,896,796 |
| Sold, not occupied Map | 208 | 4,401 | 421,032 |
| For seasonal, recreational, or occasional use Map | 5,418 | 55,473 | 4,649,298 |
| For migrant workers Map | 101 | 461 | 24,161 |
| Other vacant Map | 2,076 | 29,297 | 3,652,759 |
| HOUSING UNITS, OCCUPIED, AVERAGE HOUSEHOLD SIZE BY TENURE | |||
| Total: Map | 2.46 | 2.47 | 2.58 |
| Owner occupied Map | 2.46 | 2.53 | 2.65 |
| Renter occupied Map | 2.47 | 2.36 | 2.44 |
| HOUSING UNITS, OCCUPIED, TENURE BY RACE OF HOUSEHOLDER | |||
| Owner occupied: Map | 29,846 | 944,485 | 75,986,074 |
| Householder who is White alone Map | 27,012 | 862,700 | 63,446,275 |
| Householder who is Black or African American alone Map | 44 | 8,106 | 6,261,464 |
| Householder who is American Indian and Alaska Native alone Map | 946 | 8,471 | 509,588 |
| Householder who is Asian alone Map | 276 | 28,280 | 2,688,861 |
| Householder who is Native Hawaiian and Other Pacific Islander alone Map | 23 | 1,196 | 61,911 |
| Householder who is Some Other Race alone Map | 1,064 | 18,640 | 1,975,817 |
| Householder who is Two or More Races Map | 481 | 17,092 | 1,042,158 |
| Renter occupied: Map | 14,980 | 574,453 | 40,730,218 |
| Householder who is White alone Map | 12,589 | 477,040 | 26,308,077 |
| Householder who is Black or African American alone Map | 73 | 16,532 | 7,868,519 |
| Householder who is American Indian and Alaska Native alone Map | 618 | 9,340 | 430,119 |
| Householder who is Asian alone Map | 101 | 17,186 | 1,943,303 |
| Householder who is Native Hawaiian and Other Pacific Islander alone Map | 45 | 2,451 | 82,021 |
| Householder who is Some Other Race alone Map | 1,152 | 31,514 | 2,940,610 |
| Householder who is Two or More Races Map | 402 | 20,390 | 1,157,569 |
| HOUSING UNITS, OCCUPIED, TENURE BY HISPANIC OR LATINO ORIGIN OF HOUSEHOLDER | |||
| Owner occupied: Map | 29,846 | 944,485 | 75,986,074 |
| Not Hispanic or Latino householder Map | 27,538 | 900,276 | 69,617,625 |
| Hispanic or Latino householder Map | 2,308 | 44,209 | 6,368,449 |
| Renter occupied: Map | 14,980 | 574,453 | 40,730,218 |
| Not Hispanic or Latino householder Map | 12,655 | 508,779 | 33,637,301 |
| Hispanic or Latino householder Map | 2,325 | 65,674 | 7,092,917 |
| HOUSING UNITS, OCCUPIED, TENURE BY HOUSEHOLD SIZE | |||
| Owner occupied: Map | 29,846 | 944,485 | 75,986,074 |
| 1-person household Map | 6,888 | 205,782 | 16,453,569 |
| 2-person household Map | 13,370 | 387,395 | 27,618,605 |
| 3-person household Map | 3,780 | 144,798 | 12,517,563 |
| 4-person household Map | 2,946 | 121,269 | 10,998,793 |
| 5-person household Map | 1,612 | 51,153 | 5,057,765 |
| 6-person household Map | 703 | 20,219 | 1,965,796 |
| 7-or-more-person household Map | 547 | 13,869 | 1,373,983 |
| Renter occupied: Map | 14,980 | 574,453 | 40,730,218 |
| 1-person household Map | 5,519 | 210,965 | 14,751,340 |
| 2-person household Map | 3,787 | 160,949 | 10,624,023 |
| 3-person household Map | 2,128 | 84,475 | 6,240,422 |
| 4-person household Map | 1,715 | 61,481 | 4,626,453 |
| 5-person household Map | 1,037 | 32,636 | 2,480,866 |
| 6-person household Map | 466 | 14,110 | 1,108,903 |
| 7-or-more-person household Map | 328 | 9,837 | 898,211 |
Loading...